Criteria Dashboard and Analytics
 Updated
by
Amy Thomas
Updated
by
Amy Thomas
To complement our reporting capabilities, our Dashboard and Analytics tools provide data visualisations that aggregate and present your candidate data in an easy to understand, insightful format.
*️⃣ Admin level users have access to all features available in your account, and all jobs that are created.
*️⃣ Users who can generate reports through Manage > Run Reports can view the Analytics tool. However, this will only contain data for jobs that you created or that have been shared with you.
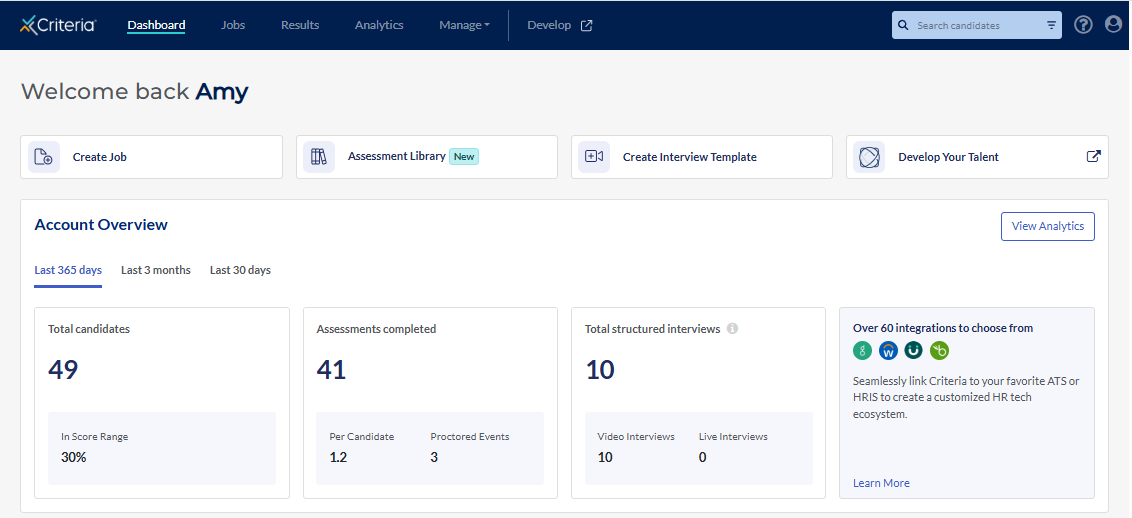
Dashboard
After logging in to your Criteria account, you’ll be taken to your Dashboard.
Quick Links
The top section contains direct links to frequently used areas and our Assessment Library.
- Create Job: Click to go straight to the Create a Job workflow.
- Assessment Library: browse our assessment portfolio to learn about the assessments we offer, as well as our structured interviewing and proctoring solutions. Click the Details button for more information and to preview the assessment. Additional information can be found here.
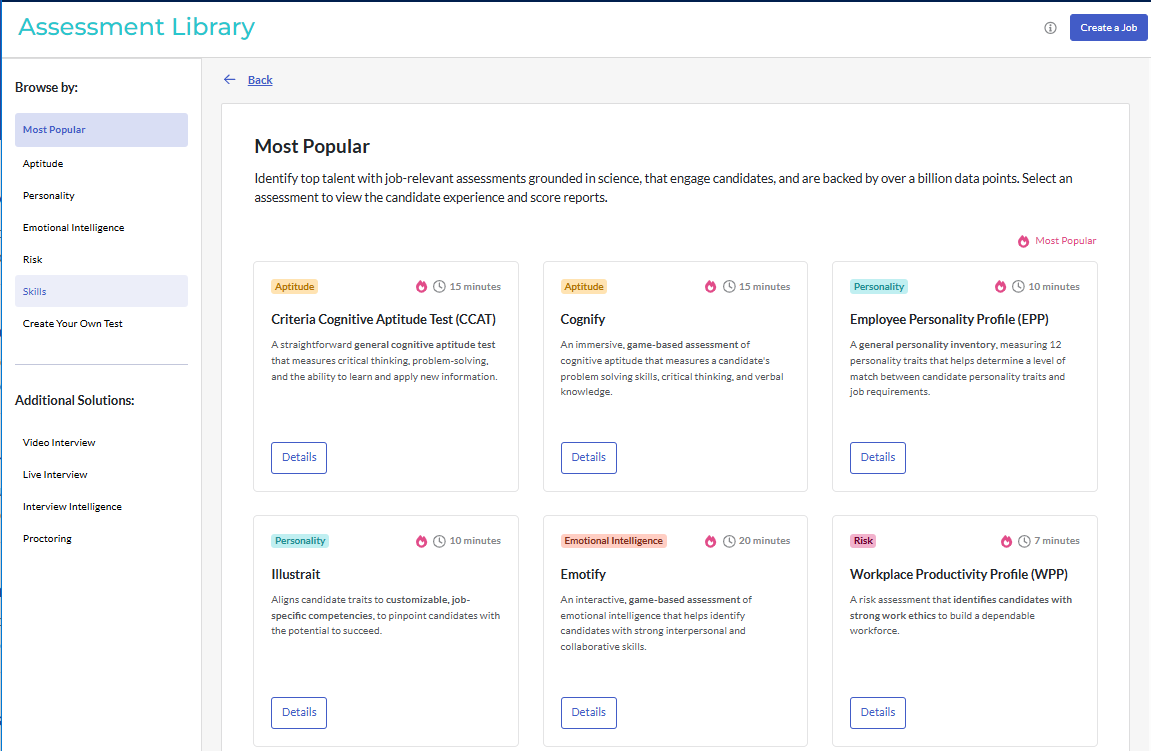
- Create interview Template: Click to go straight to the Create Interview Template workflow (Video or Live).
- Develop Your Talent: if your subscription includes access to Develop, you will be automatically logged into your Develop account.
Account Overview
View the usage at a glance for your account for the last 365 days, last 3 months, or last 30 days.
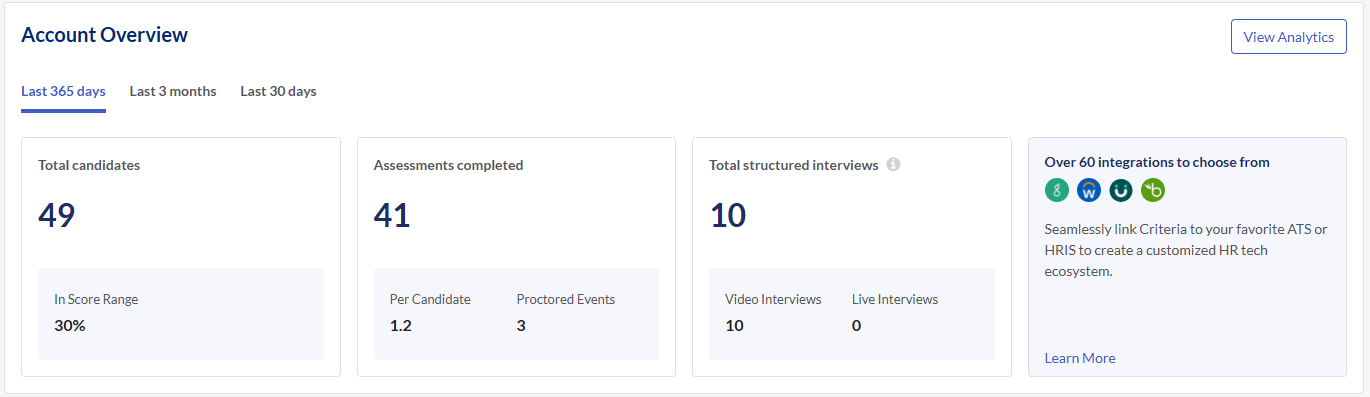
- Total candidates: The total number of candidates who have completed their assessments or structured interviews for the period selected. In Score Range indicates how many of these candidates met the score range for one or more assessments.
- Assessments completed: This number represents the total number of individual assessments that have been completed by candidates. Per candidate indicates the average number of tests each candidate completed and Proctored Events indicates how many of the Events were completed under proctored conditions.
- Total structured interviews: This number represents the total number of video interviews and live interviews completed for candidates. A video interview is considered completed when it is submitted by the candidate. A live interview is considered completed when at least one evaluation has been submitted.
- Criteria offers integrations with over 60 ATS partners. Click Learn More to open the Integrations Marketplace, where you can explore the options in greater detail. View our integrations FAQ page.
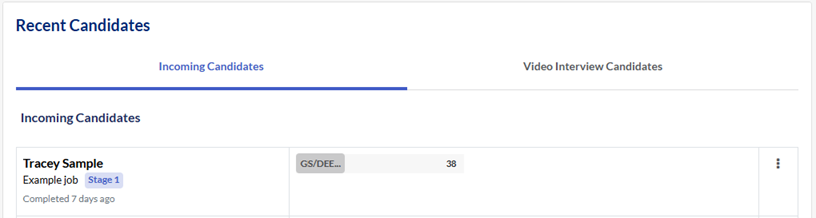
Recent Candidates
- Incoming Candidates: Candidates who have recently completed assessments will be listed here, with the most recent at the top. Click on the candidate's name to open their candidate card, or click on the job title to open the Results page in the job.
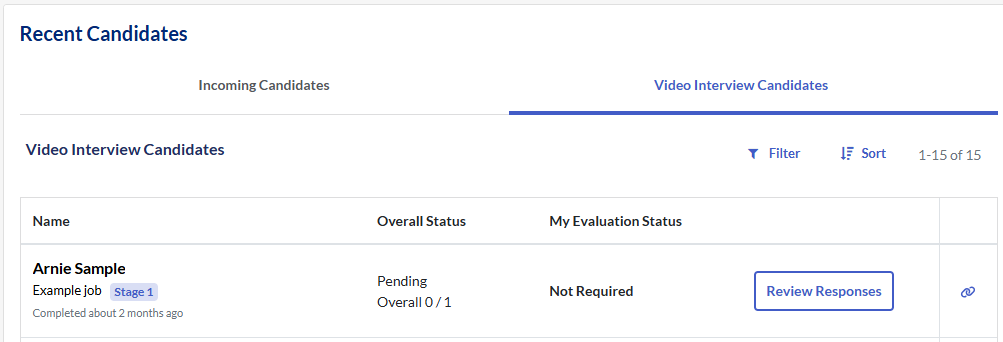
- Video Interview Candidates: Candidates who have recently completed a video interview will be listed here, with the most recent at the top. View the candidate's responses or begin your review of their responses (if you are an evaluator). Click the 🔗 link icon to access the interview links.
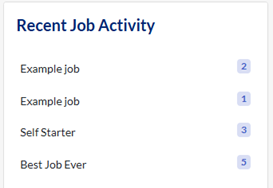
Recent Job Activity
A list of jobs with recent activity is shown, with the latest at the top. Click the job title to go to the job’s Results page.
Analytics
There are two ways to access the Analytics page. Note that if you do not have access to Manage > Run Reports, you will see a insufficient permissions message when you click on the page and you will be redirected to the Dashboard.
- On the Dashboard, click View Analytics in the Account Overview section.
- Click Analytics in the top menu.
To get started, set your filters and the Criteria platform will display your results immediately.
Filters
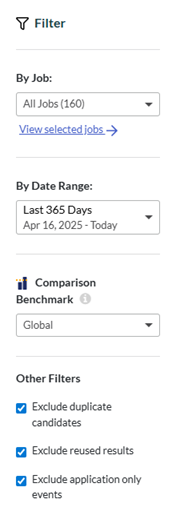
- By Job: by default, All Jobs is selected. Click the arrow to select from: All Jobs, All Active Jobs, All Inactive Jobs, or Select One or Multiple Jobs.
- Clicking Select One or Multiple Jobs or View selected jobs opens the job list modal. Select the jobs you would like to view the Analytics for, then click Done.
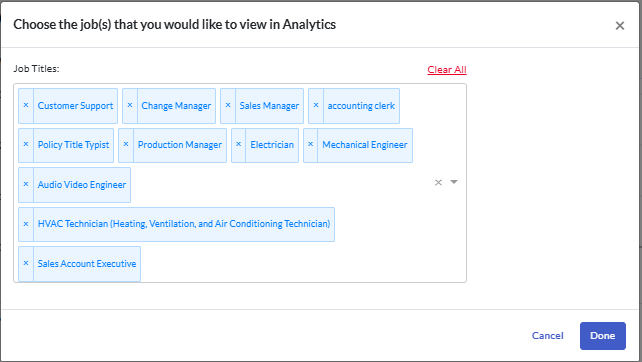
- Clicking Select One or Multiple Jobs or View selected jobs opens the job list modal. Select the jobs you would like to view the Analytics for, then click Done.
- By Date Range: by default, Last 365 Days is selected. Click the arrow to select from: Last 7 Days, Last 30 Days, Last 90 Days, Last 365 Days, All Time, or Custom Date Range.
- If Custom Date Range is selected, enter the From and To dates, then click Apply.
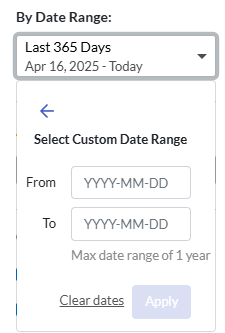
- If Custom Date Range is selected, enter the From and To dates, then click Apply.
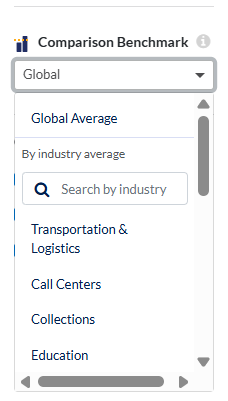
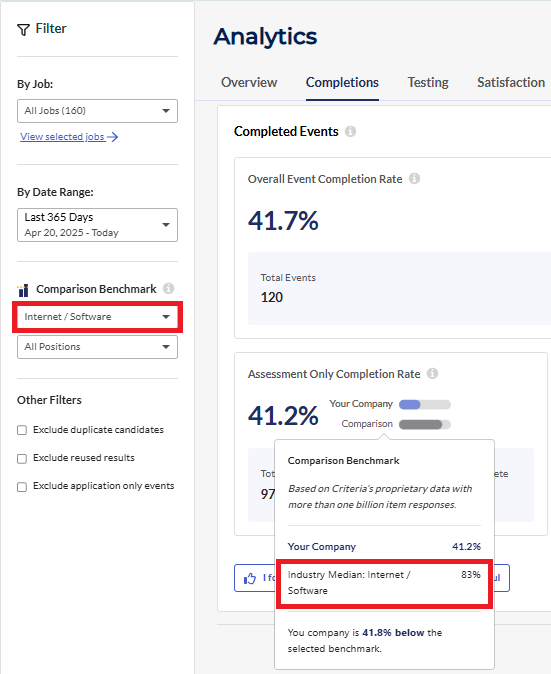
- Comparison Benchmark: click and choose a benchmark to compare your data against.
- Criteria Global Average: These are benchmarks that use all of the candidate data that Criteria has collected.
- Industry & Position Average: These are benchmarks that use candidate results that belong to a specific industry or position.
Other Filters
- Exclude duplicate candidates: Events that have been copied will not be included.
- Exclude reused results: Events where the candidate's previous results were reused will not be included.
- Exclude applicant only events: Events that only have an application form will not be included.
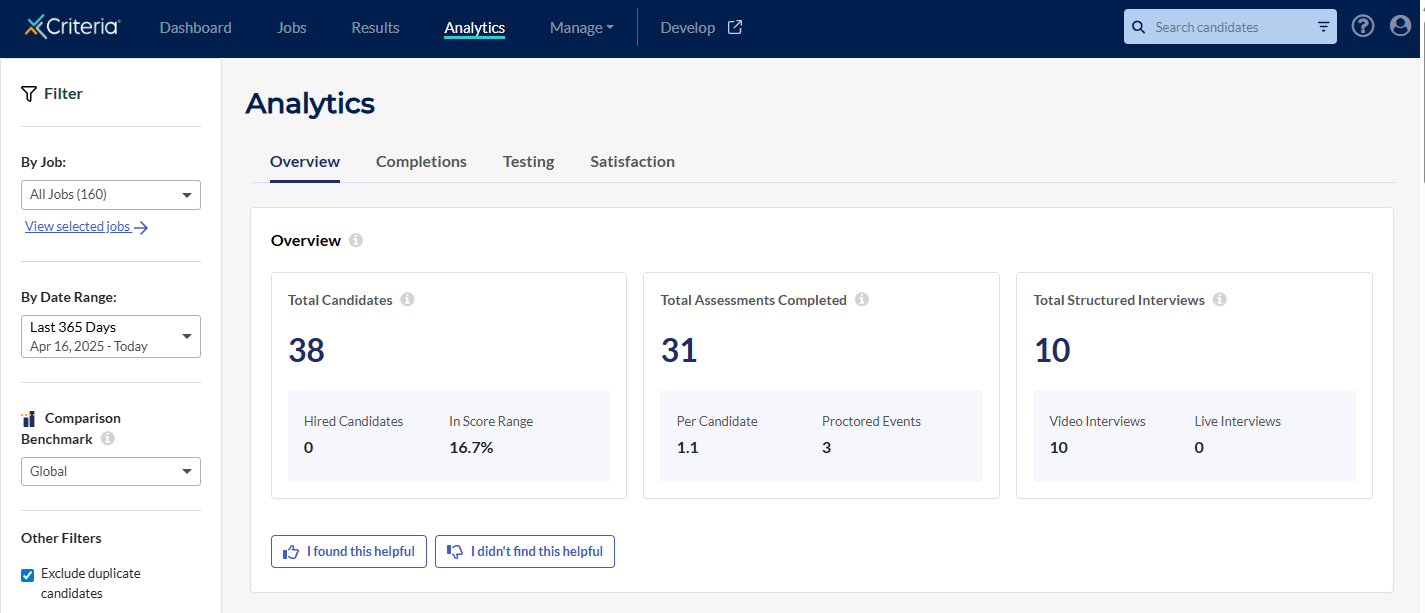
Overview
This section mirrors the Account Overview section on your Dashboard. (If the numbers do not appear to match, try unticking the Other Filters.)
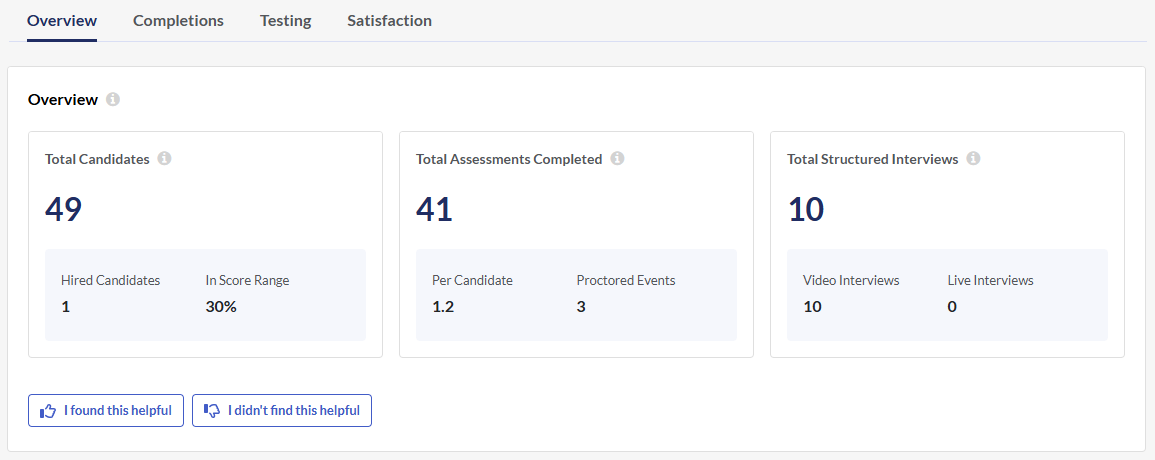
- Total candidates: The total number of candidates who have completed their assessments or structured interviews for the period selected. In Score Range indicates how many of these candidates met the score range for one or more assessments.
- Assessments completed: This number represents the total number of individual assessments that have been completed by candidates. Per candidate indicates the average number of tests each candidate completed and Proctored Events indicates how many of the Events were completed under proctored conditions.
- Total structured interviews: This number represents the total number of video interviews and live interviews completed for candidates. A video interview is considered completed when it is submitted by the candidate. A live interview is considered completed when at least one evaluation has been submitted.
Completions
Either click on the Completions tab or scroll down the page to view this section.
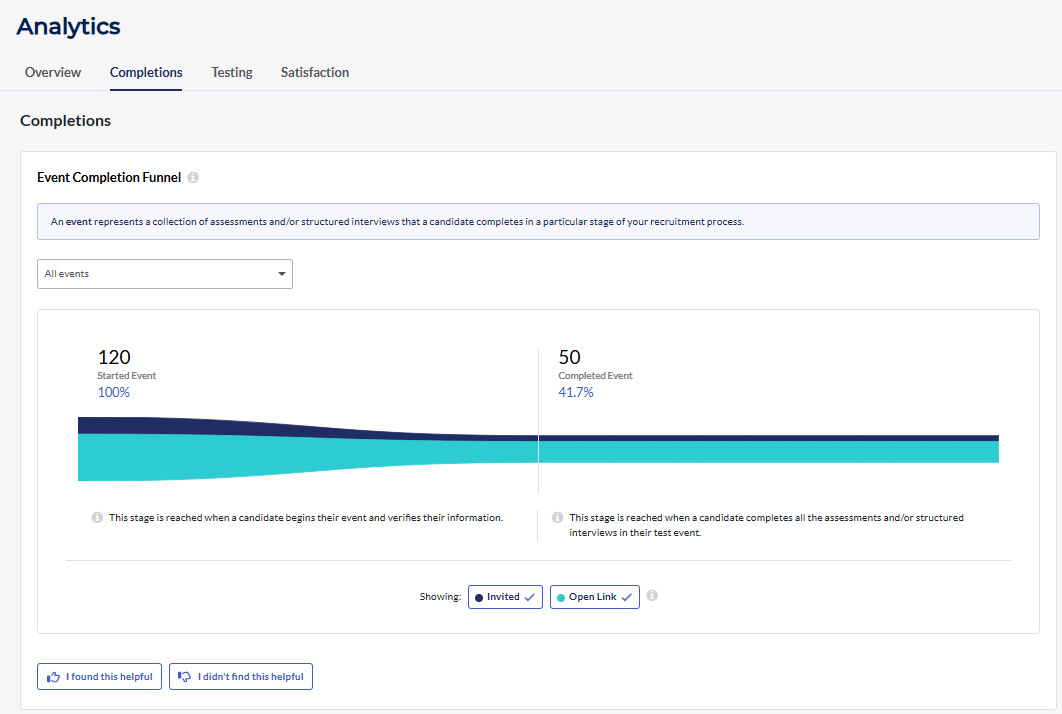
Event Completion Funnel
The Event Completion Funnel enables you to track the candidate journey from invitation through event completion. Identify key conversion points and where candidates drop off to refine your hiring process, improve completion rates, and achieve better outcomes.
An event represents a collection of assessments and/or structured interviews that a candidate completes in a particular stage of your recruitment process. Click the All events field to filter the funnel to show Events that only contain assessments, only contain video interviews, or only contain assessments and video interview.
- Started Event: This stage is reached when a candidate begins their event and verifies their information.
- Completed Event: This stage is reached when a candidate completes all the assessments and/or structured interviews in their test event.
In our example below, of the 120 candidates who started their Event, only 50 (or 41.7%) completed all the tasks set.
Hover over the funnel to view the percentage of candidates who were invited through a direct invitation link and the percentage of candidates who used an open link.
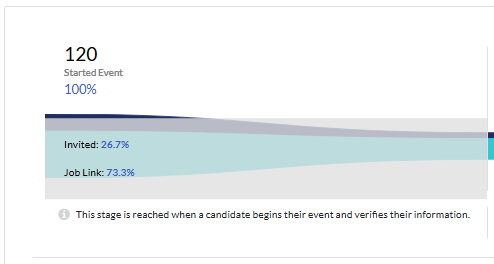
To only view candidates that were created through an open link, click on Invited beneath (to toggle it off). To only view candidates that were created through a direct invitation link, click Open Link (to toggle it off). (One or both of these options must be ticked.)
Completed Events
An Event is considered complete once a candidate finishes all assessments and structured interviews associated with that Event.
The completion rate measures the proportion of started events that candidates have completed. It's calculated as the number of completed events divided by the number of started events, expressed as a percentage.
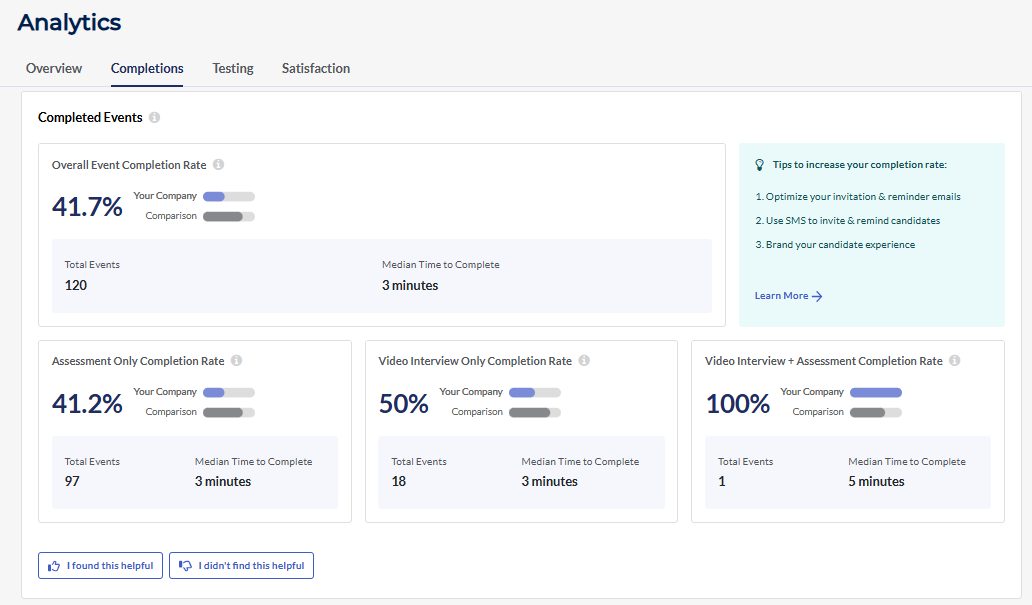
- Overall Event Completion Rate: This completion rate includes all Events for the specified time frame and jobs.
- Assessment Only Completion Rate: This completion rate is specific to Events that contain assessments only.
- Video Interview Only Completion Rate: This completion rate is specific to Events that contain a video interview only.
- Video Interview + Assessment Completion Rate: This completion rate is specific to Events that contain both assessments and a video interview.
Select a Comparison Benchmark in Filters to compare your candidate data against.
💡Optimize your invitation & reminder emails
💡Use SMS to invite & remind candidates
💡Brand your candidate experience
Testing
Either click on the Testing tab or scroll down the page to view this section.
Test Volume
This chart shows the number of completions across your candidates for each individual assessment. By default, the 4 most commonly used assessments are displayed. Click View all assessments to display the full list.
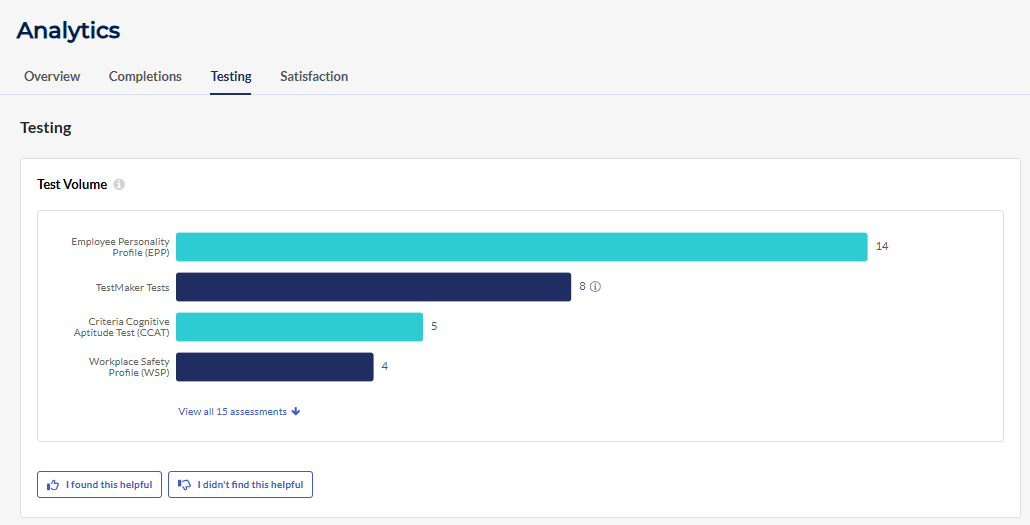
Note: The TestMaker Tests count will include all individual assessments created using TestMaker.
Test Performance
This section shows how your candidates have scored on individual assessments.
Click the Assessment field to select a specific assessment. Click the Parameter field to view these results.
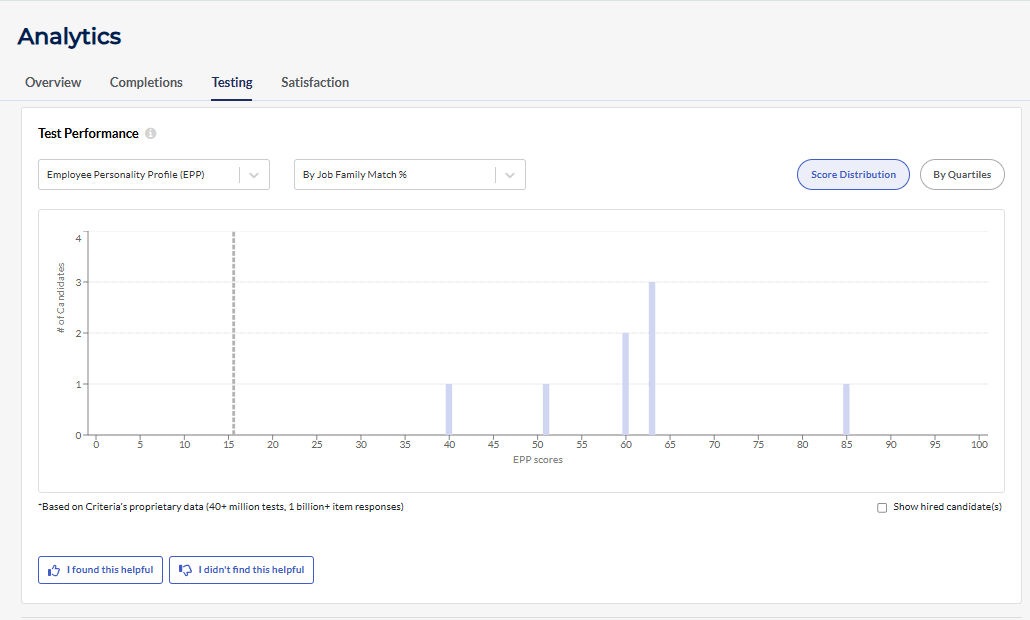
- Score Distribution: Click to view the distribution of scores in a bar graph. This format displays individual scores.
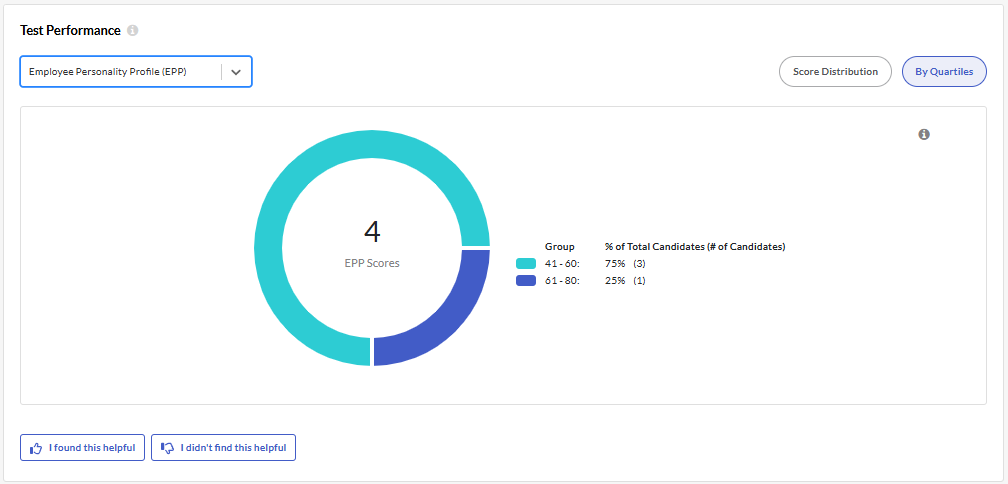
- By Quartiles: Click to view the distribution of scores in a pie graph. This format divides the scores into equal-sized groups. The size of the slices represents the number of candidates in each group.
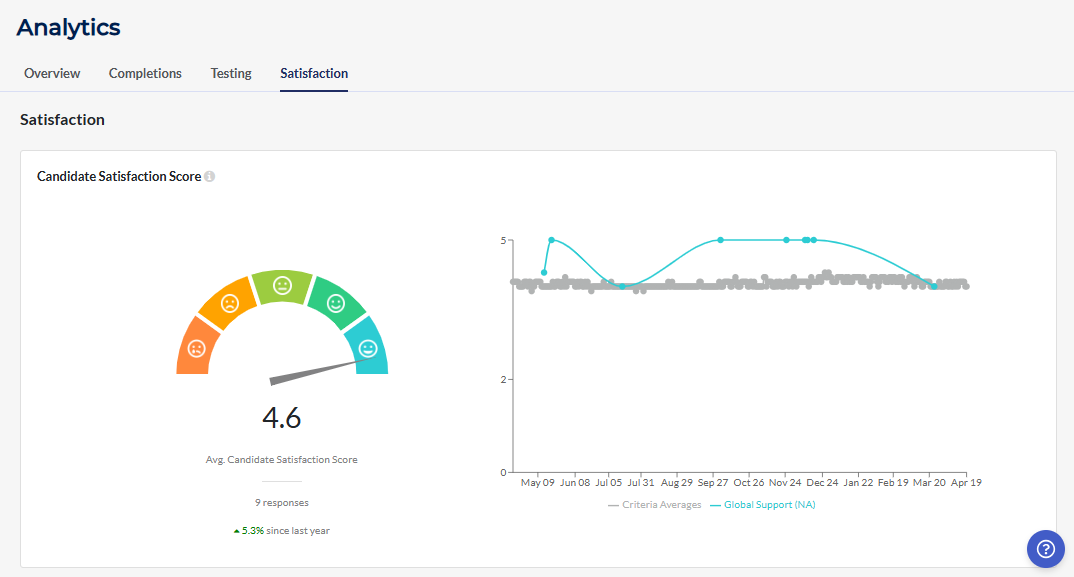
Satisfaction
Either click on the Satisfaction tab or scroll down the page to view this section.
The Candidate Satisfaction Score shows the average rating candidates selected when asked to rate their assessment experience. This graph includes the ratings your candidates chose and the overall Criteria scores and trends for the period selected.
Candidates are presented with the opportunity to rate their experience once they have completed all the tasks you invited them to complete. Providing this feedback is voluntary.